
Data Dashboard
Instructions
Welcome to the All About Girls of Color Data Dashboard
- Click on the map image below to open the All About Girls of Color Map.
- Use the plus (+) and minus (-) icons to zoom in or out on the top left-hand side. Or use your mouse scroll bar to zoom in or out on the map.
- Click on the search icon, in the legend, in the bottom right-hand side. Enter an address or a city, and the data for that area will appear.
Introduction
San Diego County's Girls of Color deserve a resource-rich environment so they can bloom without restraint.
Girls of Color need a healthy environment, fertile soil rich in nutrients. They need to be embedded in effective and responsive educational systems, live in safe neighborhoods with accessible parks and open spaces that promote exercise, and supermarkets with goods that are part of a healthy diet. Girls of Color need their families to earn a living wage, have secure and affordable housing, and easily see a path, with hard work, to getting upwardly mobile jobs.
Therefore, we have chosen to use a community health lens. We are excited to partner with the Institute for Public Strategies, which has shared a map based on the nationally recognized Healthy Places Index.
Data can answer the questions we need to ask about the available resources to Girls of Color. If these resources fall short, data gives the tool we need to develop effective advocacy for structural changes that address the root causes.
All About Girls of Color Map
(Based on the Healthy Places Index)
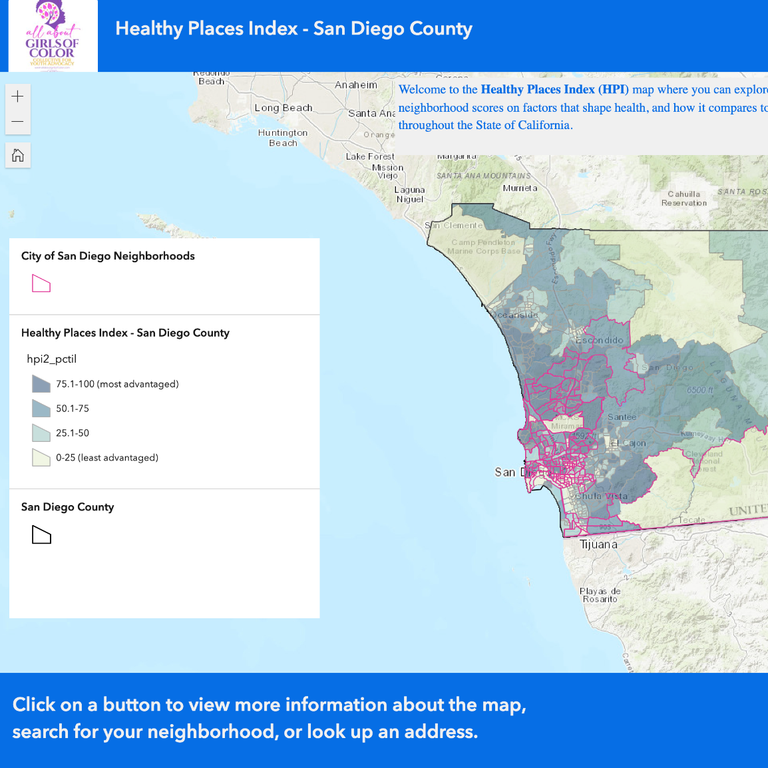
What does this map tell us?
The health of a community is vital because it can predict human development outcomes. For instance, neighborhoods that are more disadvantaged than others may experience higher levels of violence, crime, substance use disorders, adverse childhood experiences, and/or mental health challenges.
The map takes into account the impact that the eight domains have on individual and community health. The eight domains are economic, education, healthcare access, housing, neighborhood, clean environment, social, transportation, and race. These domains are the basis of the percentage scores that state the levels of advantage.These social factors are fundamental to a person experiencing physical, mental, and social well-being.
Why is the map important to systems change?
Data is key to making policy decisions: Which neighborhoods have the greatest need? What resources are lacking that makes it a challenge to achieve positive health and safety? Which populations are most advantaged and disadvantaged? Are communities of color more disproportionately disadvantaged?
Decision-makers must understand these community conditions when allocating resources. Community members must know what puts them at an advantage or disadvantage in achieving the kind of neighborhood where we all want to live, work, and play.
Use the map to discover the social factors that impact particular neighborhoods. Refer to the instructions above on how to navigate the map.
Additional Resources
Below are a list of resources to help you navigate the All About Girls of Color Data Dashboard and Map.
Click the resource below to download the file.

© Copyright. All rights reserved.